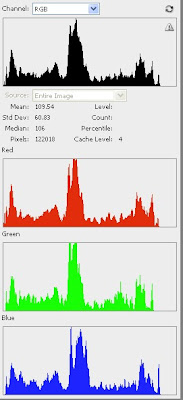
Before getting into the experiment showing the effect of color temperature on a camera's output, I want to touch on histograms. If you are familiar with histograms, please feel free to skip this little side excursion. If you are not familiar with histograms, then you will need this information to better interpret what follows.
 Digital cameras represent colored light using three channels of color, Red, Green, and Blue. Using combinations of these three primary colors, we can model virtually any color of visible light. There are other ways to model the color (CMY, HSB, Lab, etc.), but that is beyond the scope of this introductory discussion. The point is that there are three color channels and to get an idea of a light's color content, we need a way to view the information from all three channels separately. If we look at the combined luminance only, then we can make no judgment about color.
Take a look at the histograms in the image above. The black histogram on top represents only luminance. It tells us about the exposure, but contains nothing about color. Below it are three more histograms by color. These represent the luminance for each color channel. In this example, the peak that shows up in the middle indicates that middle gray is a dominant color. All three of the histograms have a similar shape, which tells us that there is a fairly even distribution of colors in the image.
In the next posting I will continue the series with a demonstration of what the camera sees when photographing under different light sources. Stay tuned...


No comments:
Post a Comment
Your comments are greatly appreciated, but please be kind. Kudos are always welcome! Please note that due to comment spamming, all comments are moderated, so it may take a little while before yours appears on the page.